Compare training runs
The single Experiment view allows you to track all the information logged for a single expeirment. To compare experiments together, you can use either: Panels or the Experiment table.
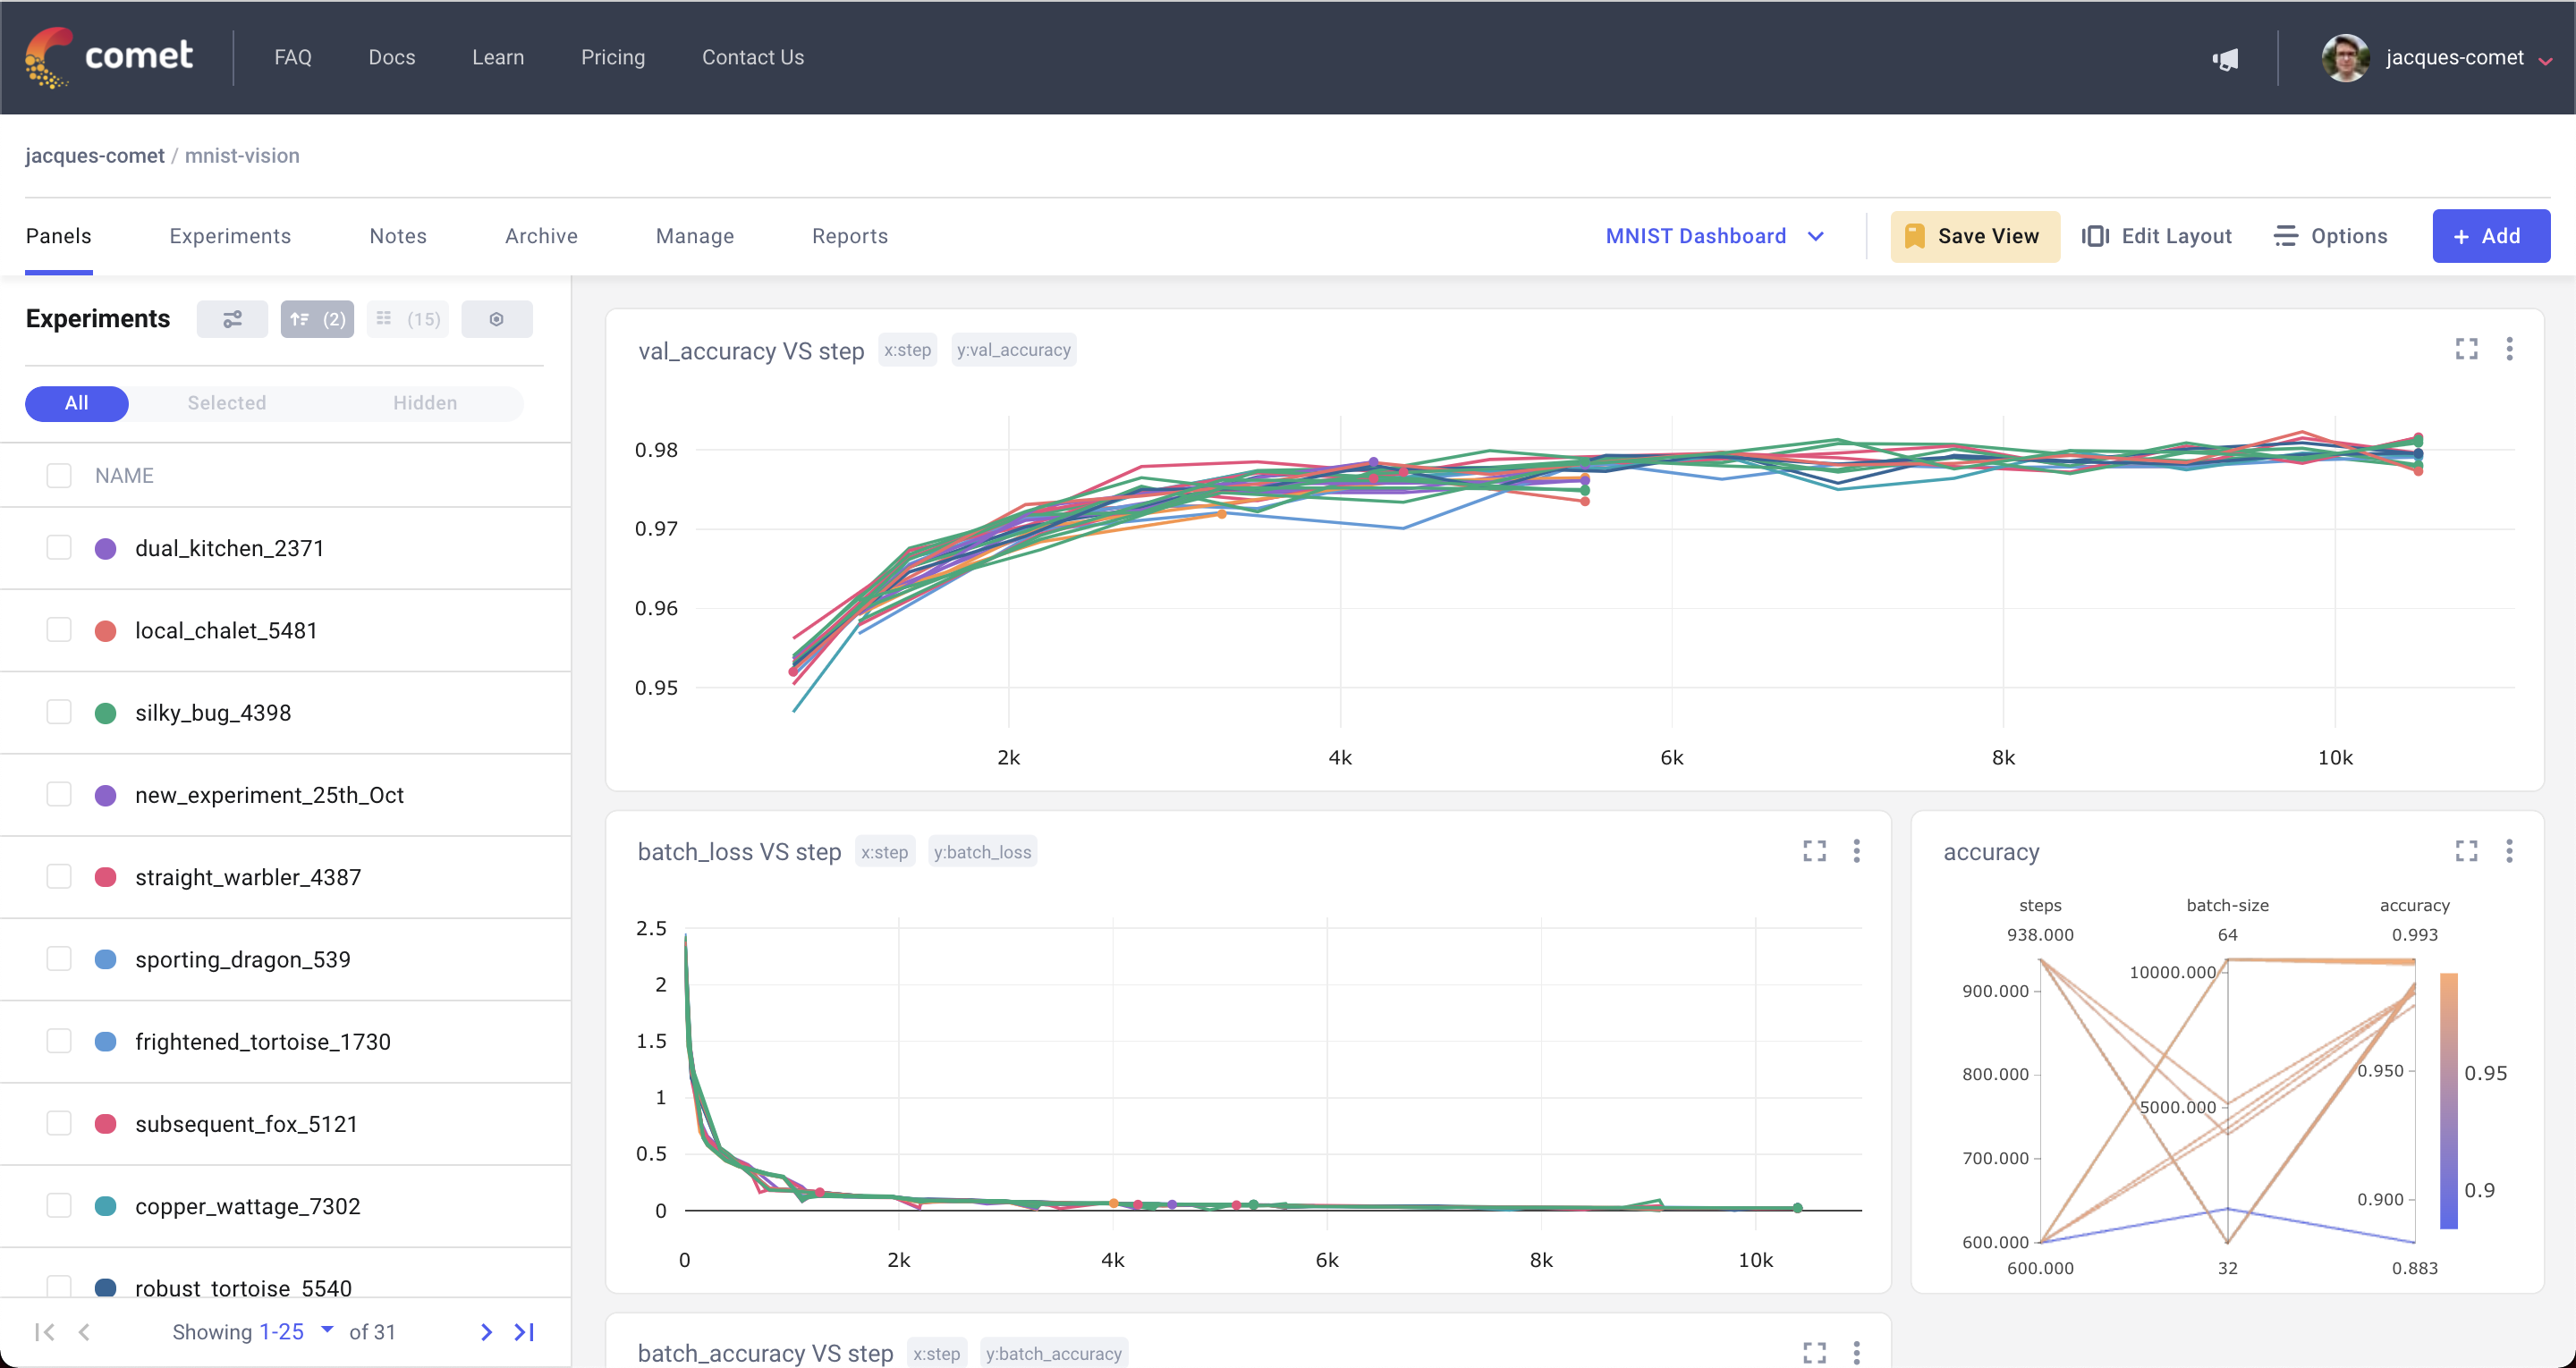
Panels
The Panels tab is a customizable dashboard for all your experiments. It can be used either to track model metrics in real time as the model trains, or to compare training runs with one another.
You can:
- Add, remove, or resize panels to fit the use case you are working on.
- Add either a built-in panel or a custom panel.
- Filter, sort, and group experiments that are displayed in the dashboard using the action buttons above the left sidebar.
Add visualizations to the dashboard
There are four types of panels you can add to the dashboard:
- Built-in: Panels built by Comet. These usually provide the vast majority of the visualizations that you will need. There are four types of built-in panel types:
- Line chart: Visualize a metric against time, step, epoch or against another or against another metric.
- Scatter chart: Visualize a metric or parameter against another metric or parameter.
- Bar chart: Visualize a metric's aggregation by experiments.
- Parallel coordinates chart: Visualize the impact of parameters on a given metric.
- Featured: Code panels built by the Comet community and curated by Comet
- Workspace: Code panels built by members of your workspace
- Public: Code panels built by the Comet community
To add a new panel to the dashboard:
- Click Add.
- Click New Panel in the list that appears.
- Click Built-in, Featured, Workspace, or Public.
- In the visualization type you would like to add, click Add.
Code Panels
All machine learning projects are unique and have use case-specific visualization needs. To support these needs, Comet provides both JavaScript Panels and Python Panels.
When Comet tracks metrics and parameters related to a training run, it stores them in a structured way. Custom panels let you query that data and then define how you would like to display that information.
Experiment table
To view the metrics and parameters associated with each experiment in a tabular format, you can use the Experiments tab.
The table is an extension of the sidebar of the panels view, which means you can easily switch between the two tabs to see additional information about experiments.
To add new columns or reorder columns, use the Columns button next to the filtering and sorting options.
Perform bulk actions on selected Experiments
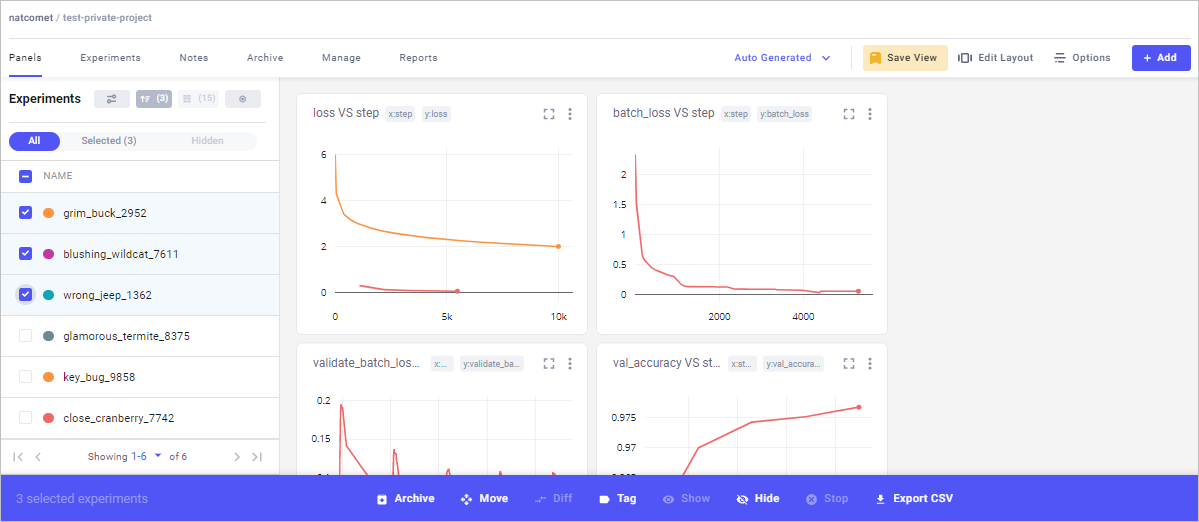
You can perform bulk actions on a selection of Experiments by checking the selection box at the far left of the Experiment row. The actions are available through the buttons that appear when you select the Experiments:
- Archive: Soft-delete Experiments. Navigate to the Project Archive tab to either restore or permanently delete your archived Experiments.
- Move: Move your Experiment to another Project. If you choose, the move can be by symbolic link (symlink). In that case, the Experiment remains in the current Project and a reference is added to the target Project.
- Diff: If you select exactly two Experiments, click the Diff button for a detailed comparison of the two. The comparison covers all aspects of the Experiments, including code and Panels. This is a very useful tool to explore the differences between two experiments.
- Tag: Add a tag to your Experiment. Select many experiments to tag them all. You can also programmatically populate tags with the Experiment.add_tag function. To create a new tag, just enter the text and press Enter.
- Show and Hide: Adjust your Experiment’s visibility in the Project visualizations. The Visible indicator in the Experiment table is clickable and shows or hides the Experiment from the Project visualizations above. You can also select the Experiments in the Project visualizations to show or hide them.
- Export CSV: Export your Experiment data.
Stop: Stop an experiment that is running on your computer, cluster, or on a remote system, while it is reporting to Comet. The running experiment receives the message and raise an
InterruptedExperimentexception, within a few seconds (usually less than 10).If you don't need to handle the exception, you can simply let the script end as usual---just as if you had pressed Ctrl+C. However, if you would like to handle the interrupted script, you can do that as well. Here is an example showing a running experiment and how the exception is caught. You can perform custom code in the except clause, if you wish.
from comet_ml import Experiment
from comet_ml.exceptions import InterruptedExperiment

experiment = Experiment()

try:
    model.fit()
except InterruptedExperiment as exc:
    # handle exception here
    experiment.log_other("status", str(exc))
    # other cleanup

model.save()
experiment.log_asset("my_model.hp5")
See also the
API.stop_experiment()method.
Filter, sort, and group
As the number of training runs increases, the panels and experiment table become heavy with data. One way to navigate the different experiments that have been created is to use Comet's filtering, sorting, and grouping options.
Filters can contain many conditions, so they allow you to select exactly which experiments you would like to see in the panels and experiments views. Filters can also be saved to the Filters library so that you can select and apply them easily, later.