Share your work
Collaboration is key to the success of machine learning projects and is at the core of the Comet platform. There are three main features that allow you to better collaborate with team members and stakeholders:
- Dashboard views: Allow you to share different dashboards tailored to the stakeholder or team member you are working with.
- Custom visualizations: Allow you to standardize the way you track model training between team members.
- Comet reports: Allow you to share your work with team members in a notebook-like format.
Dashboard views
The analysis of model training runs is often multi-faceted, with different stakeholders and team members looking at different metrics. For example, dashboard views allow you to build different dashboards for technical stakeholders and business stakeholders. An additional example: dashboard views can be used by data scientists to compare model performance according to different baselines.
To create a new view, go to a project and make changes to the dashboard panels or update filtering, sorting or grouping options. You can then save the view.
Custom visualizations
Comet comes with four built-in panels that provide most of the visualizations that you will need. For more information, see add visualizations to the dashboard.
For visualizations that are not covered by the built-in panels, you can use create your own using Code Panels.
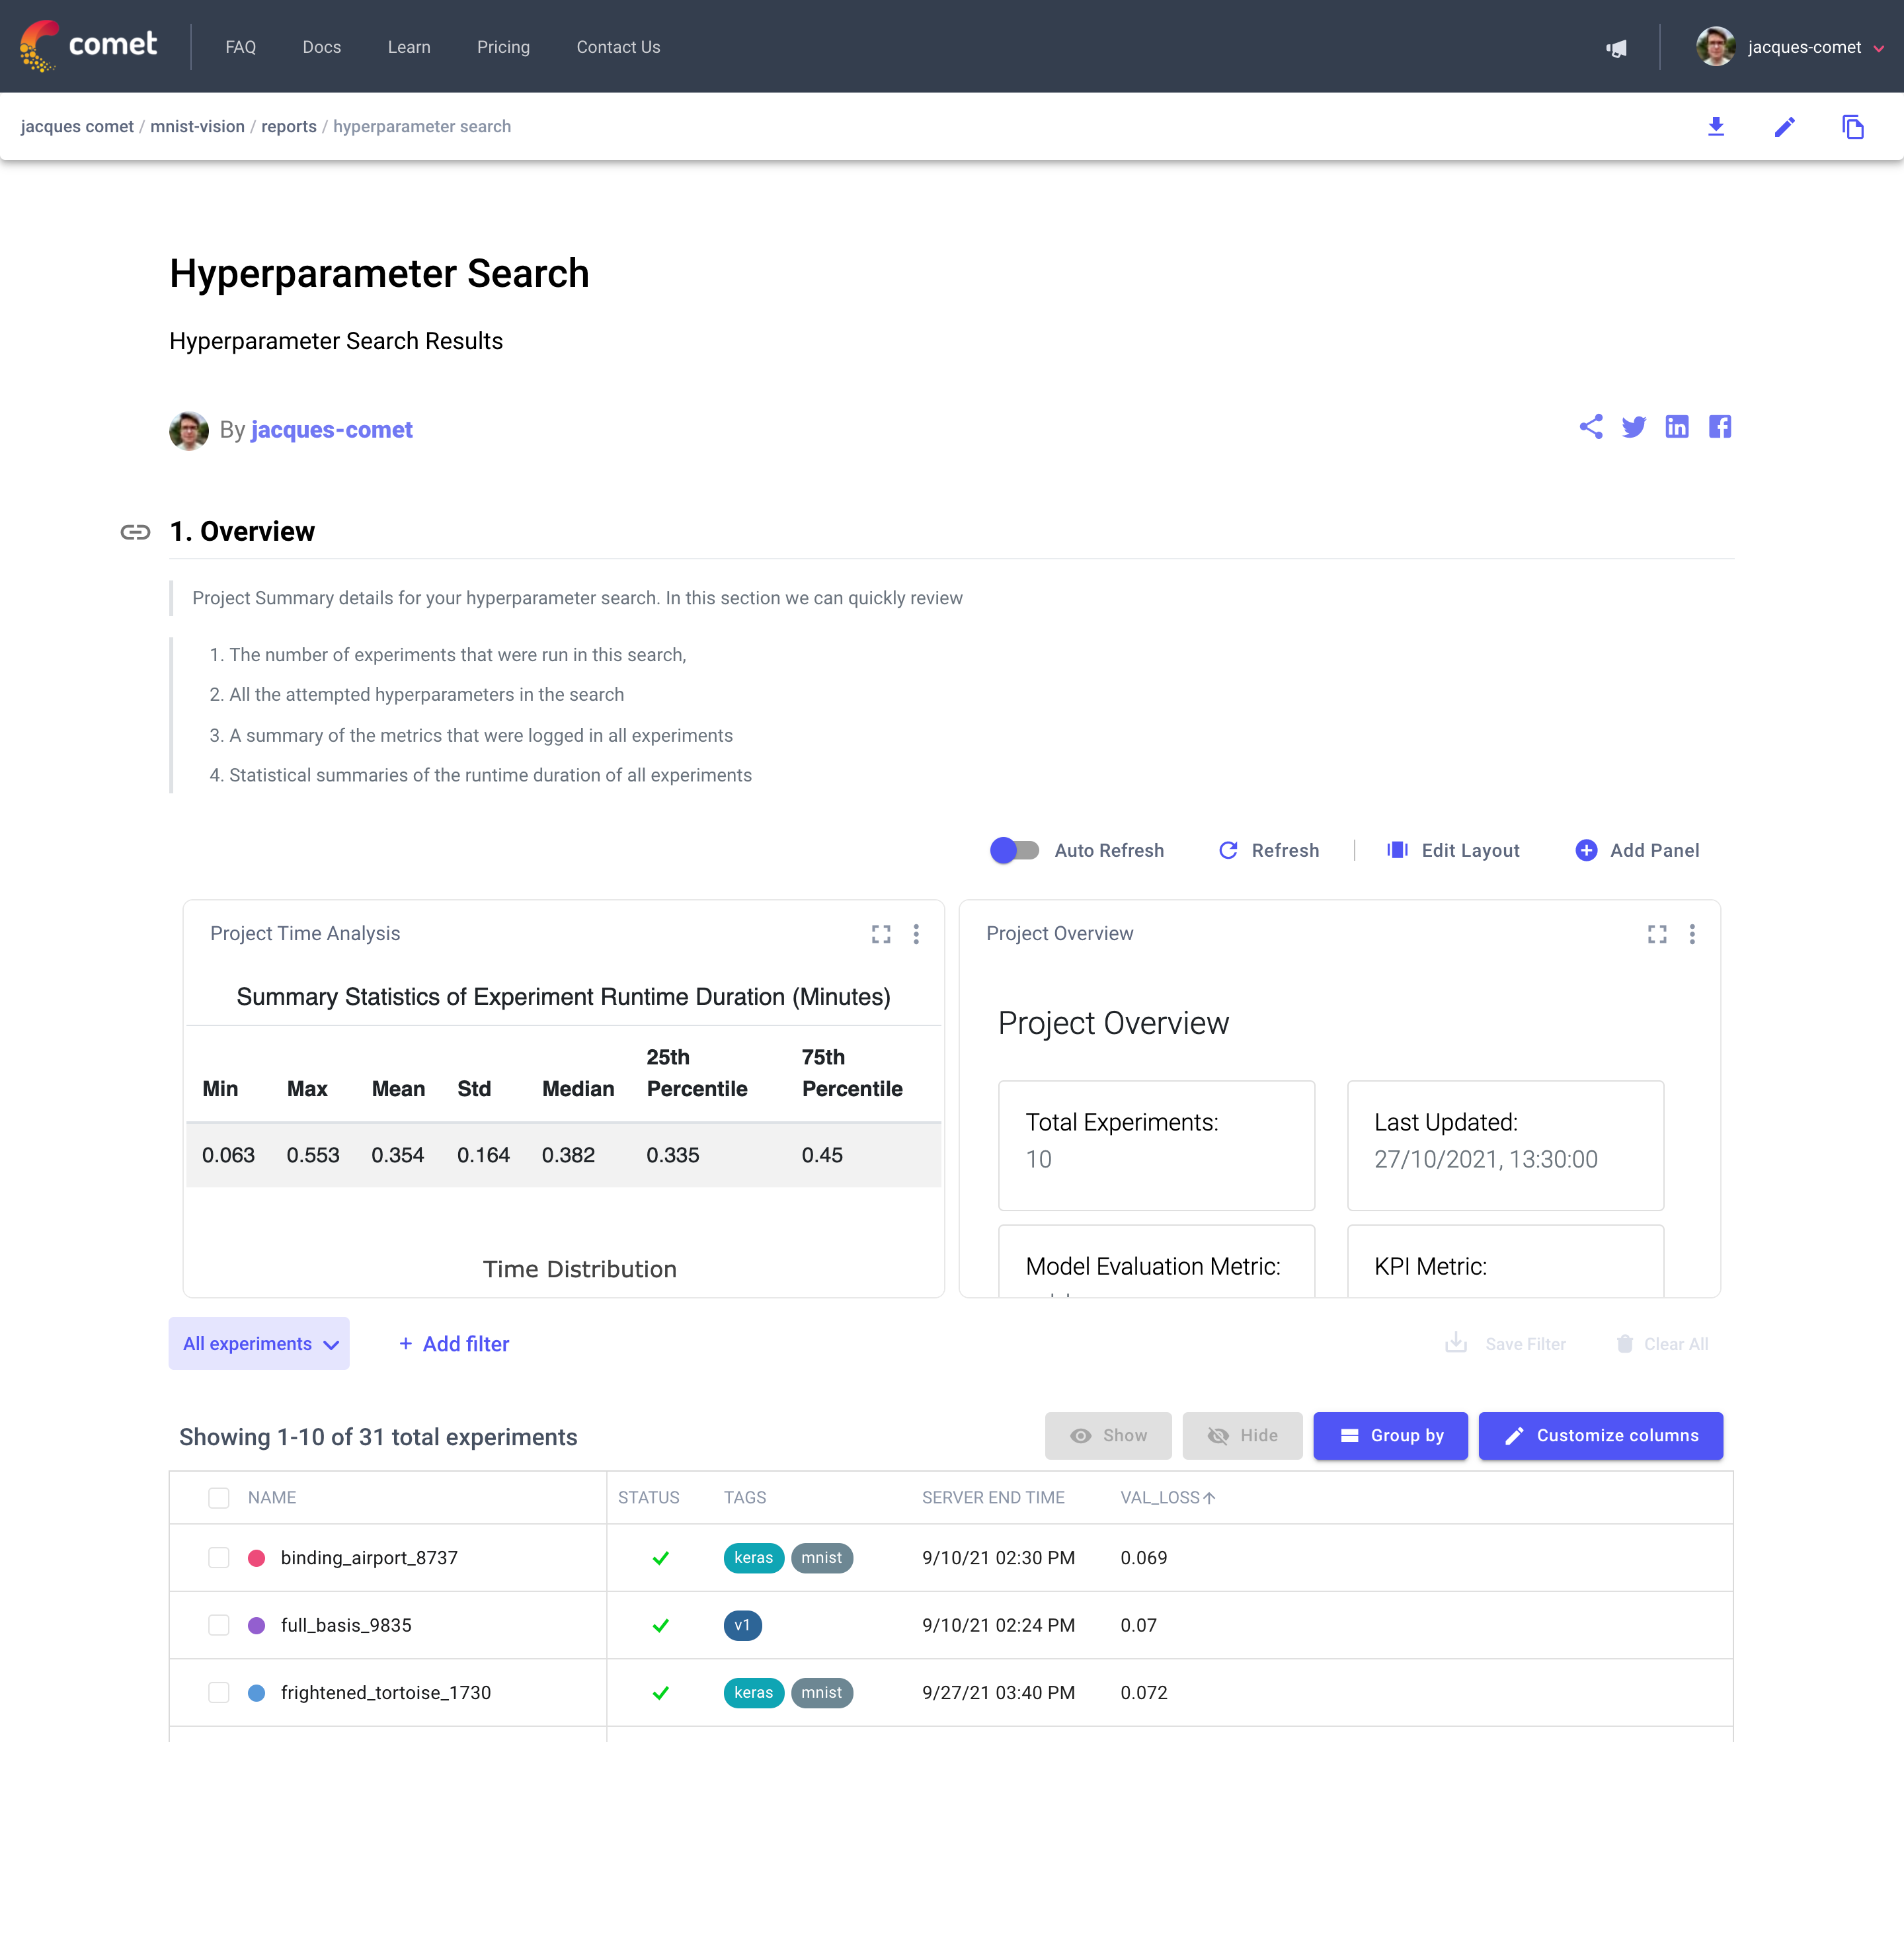
Comet reports
Comet reports allow you to create a customized analysis of a set of experiments in a Comet Project. A report comprises any number of sections composed of:
- Heading and markdown text
- Comet section composed of Comet Panels and the Comet Experiment table
- Summary and markdown text
By adding any number of sections, you can create a complete analysis over the entire process. In addition, you can save these reports and reuse them in other projects.
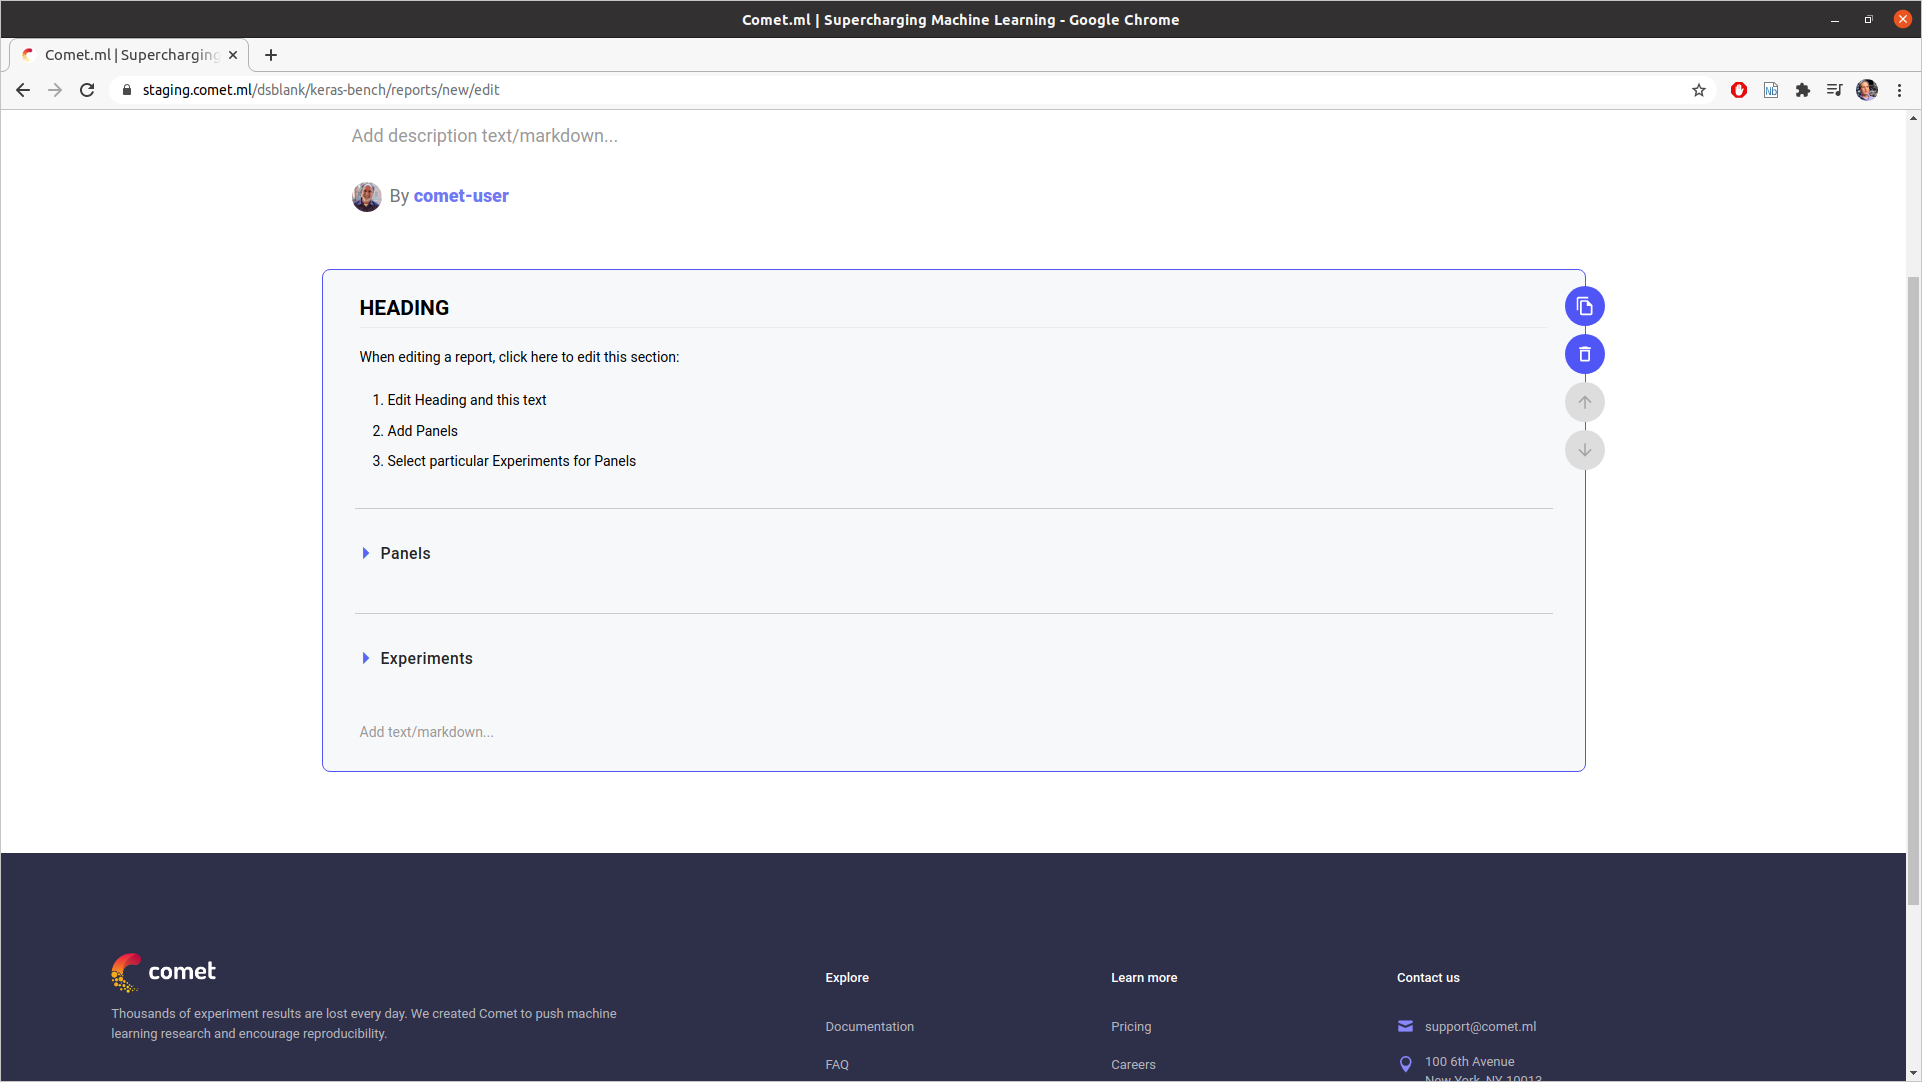
Sections
As mentioned, your new report is populated by a default Section. Each section is composed of the following parts:
- Section heading and markdown
- Panels
- Experiment Table (for filtering and selecting)
- Markdown
Here is a view of a Section with the Panels and Experiments collapsed:
Here is a view of a Section with the Panels and Experiments expanded:
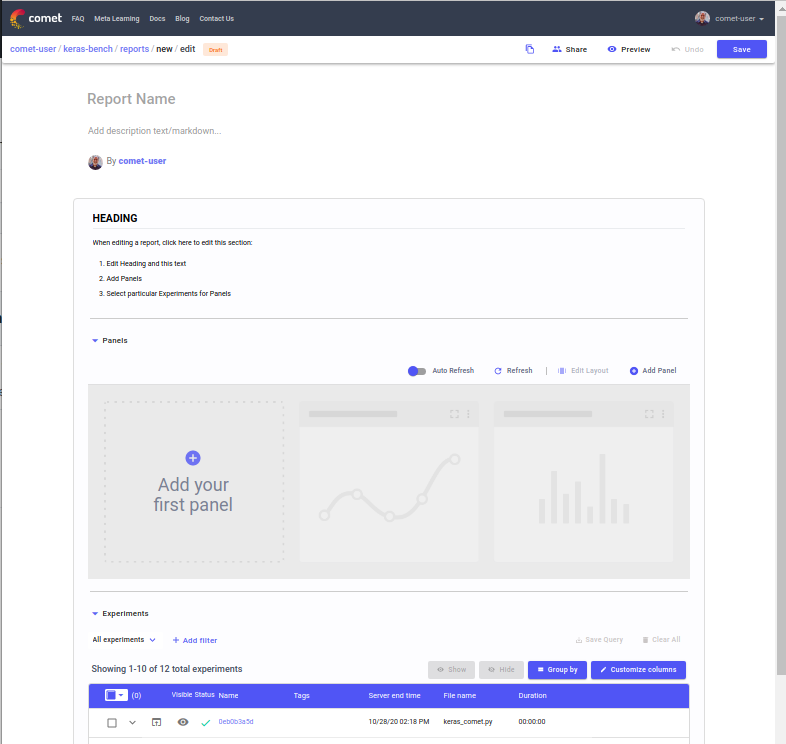
The suggested workflow is generally as follows:
- Select the experiment or experiments in the Experiment Table that you wish to highlight
- Select the Panels that you wish to analyze
- Write descriptive text, code, and mathematical equations in the markdown
In each section, you can decide to hide the Experiment table by simply collapsing it in the editor.
Additional sections
To add additional sections (either above or below), simply edit a Report, move your mouse above (or below) an existing section, and click Add section here.
Report options
When viewing a report, the following operations are available:
- Download
- Edit
- Duplicate
- Share